Module example
In this section, we present how to code an example DeckGL module on Brix WS that connects with a project in CityScopeJS and displays various visualizations.
Currently, Brix WS is not published as a Python library available through pip. Consequently, the first step would be to download the code from GitHub.
MicroBrix
It's available through Google colab a notebook with the necessary code to connect to CityIO and send module data to CityScopeJS:
https://colab.research.google.com/drive/1Ulle6CbXMxDUJnQVmsQ6-0yWwgl8Egb3?usp=sharing
BrixWS
Basic structure of a module
The basic structure of any module will be as follows:
from brix.classes import DeckGLIndicator

import random
from numpy import mean
class ExampleModule(DeckGLIndicator):

    def setup(self):
        self.name = 'example'

    def load_module(self):
        pass

    def return_indicator(self, geogrid_data):
        # Module code
The setup function will be used to define the values of some variables, such as the name of the module.
Data loading actions should go in the load_module function
return_indicator will be the main function of any module, in this one, you can read the data of the grid realted to the project, executed the necessary calculations to obtain the module output, and return it in a proper structure to be sent back to CityIO.
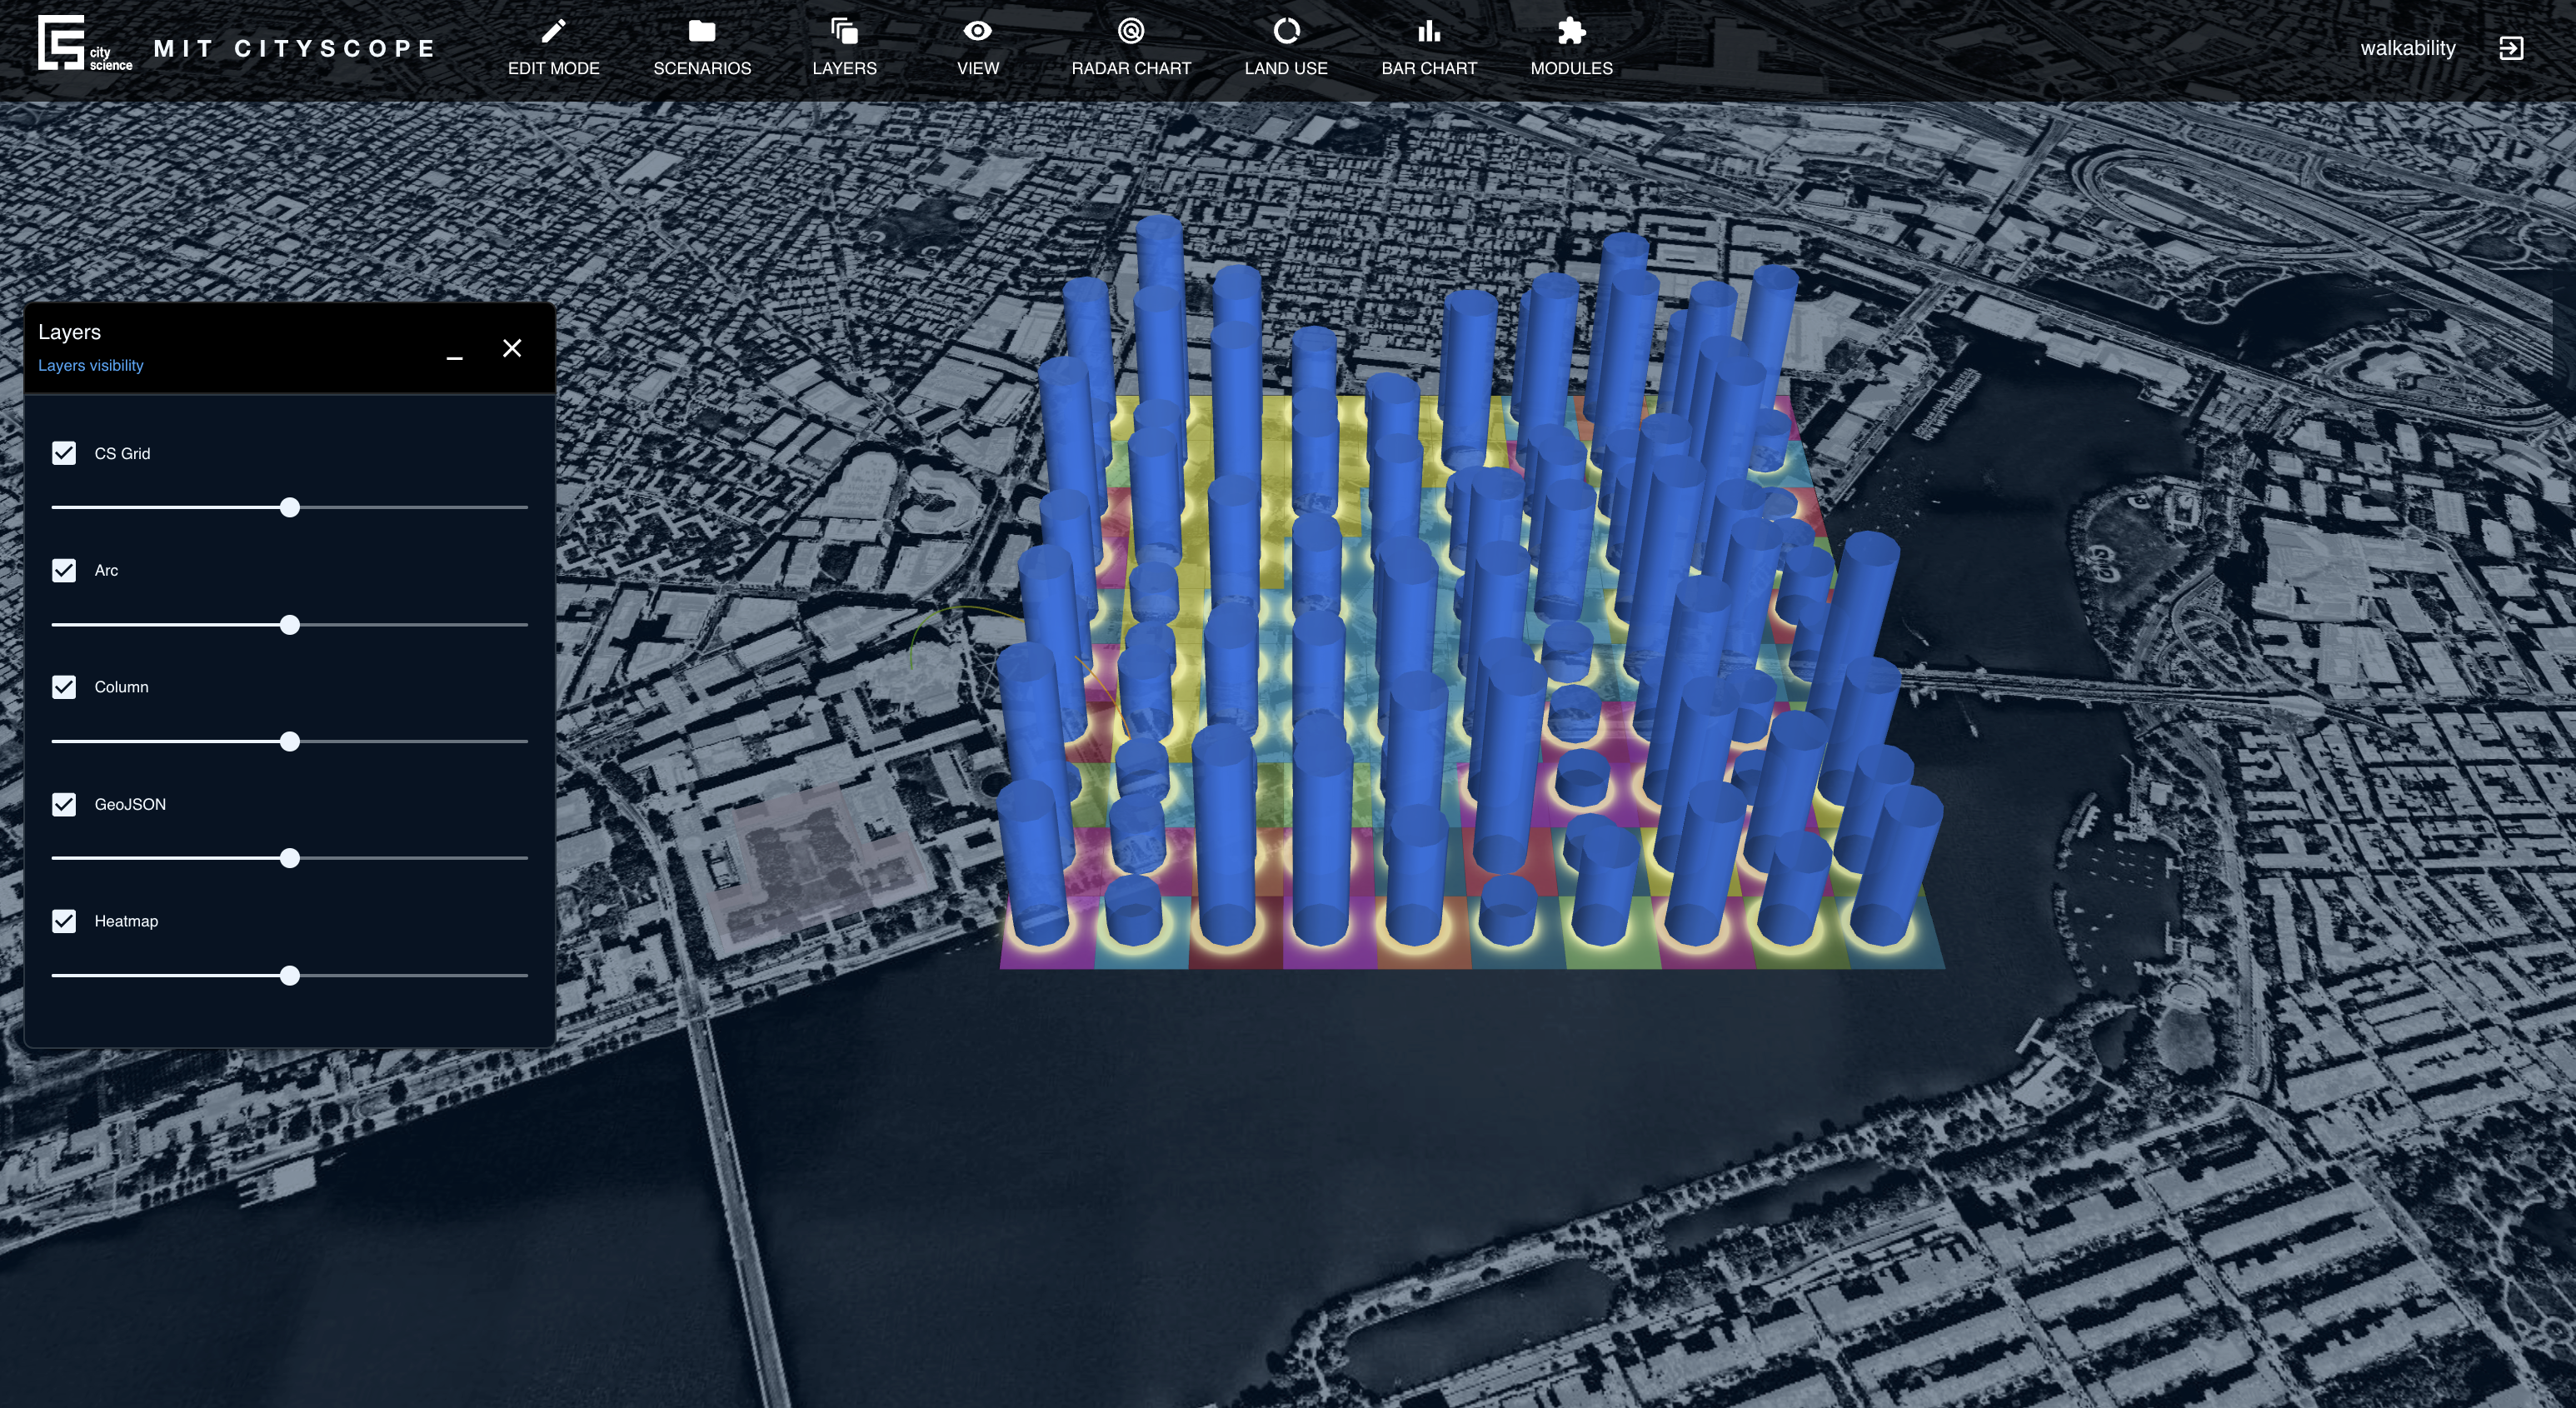
DeckGL Modules: adding layers
In order to generate a DeckGL module, we need to send back to CityIO all the layers that will compose the visualization in CityScopeJS. In this example, we use different types of layers to generate a random indicator: heatmaps, columns, arc, and geojson.
    def return_indicator(self, geogrid_data):

        data = []

        #HEATMAP
        features = []
        for cell in geogrid_data:
            feature = {}
            lat,lon = zip(*cell['geometry']['coordinates'][0])
            lat,lon = mean(lat),mean(lon)
            feature['coordinates'] = [lat,lon]
            feature['weight'] = random.random()*10
            features.append(feature)

        data.append({"type":"heatmap","data":features,"properties":{}})

        #ARC
        arc_data = [{
            'inbound': 72633,
            'outbound': 74735,
            'from': {
                'name': 'MIT Media Lab',
                'coordinates': [-71.08727713271684, 42.36041314214483]
            },
            'to': {
                'name': 'MIT CSAIL',
                'coordinates': [-71.09060913355545, 42.36168851347742]
            }
        }]
        data.append({"type":"arc","data":arc_data,"properties":{"width":1}})

        #COLUMNS
        features_columns = []
        for cell in geogrid_data:
            feature = {}
            lat,lon = zip(*cell['geometry']['coordinates'][0])
            lat,lon = mean(lat),mean(lon)
            feature['centroid'] = [lat,lon]
            feature['value'] = random.random()*300
            features_columns.append(feature)

        data.append({"type":"column","data":features_columns,"properties":{}})

        #GEOJSON
        geojson_data = {"type": "FeatureCollection","features": [{"type": "Feature","properties": {},"geometry": {"coordinates": [[[-71.09236362469034,42.35778603125499],[-71.08986747898945,42.3585765398804],[-71.0901949616614,42.35911429516614],[-71.09076987568574,42.358931458885564],[-71.09126473839052,42.35978648280218],[-71.09261105604213,42.35938317108344],[-71.09214530290863,42.3584421003398],[-71.09268382996976,42.35830766051154],[-71.09236362469034,42.35778603125499]]],"type": "Polygon"}}]}

        data.append({"type":"geojsonbase","data":geojson_data,"properties":{}})


        return data
The straightforward solution is, for each layer, calculate the necessary data, and then append the layer to the ouput array.
It is important to note that this method could be follow with any set of the available layers.
Connecting with CityIO
Connecting a module to a CityScope project will only require to create a Handler, indicating the name of the table that you want to connect to. Then, add the indicator (module) previously defined to the handler, and start it.
from brix.classes import Handler

indicator = ExampleModule()

H = Handler(quietly=False,
            table_name='walkability')
H.add_indicators([
        indicator
        ])
H.listen()
Visualizing the result in CityScopeJS
When everything is done, and you run the code, this will send to CityScopeJS the result of the module.